Enterprise Condition Monitoring

Catch failures weeks before they stop your line.

Cryden monitors every critical machine in your plant continuously, catches degradation while it is still cheap to fix, and puts the repair into a window you planned. Every number on the screen traces back to a reading, a threshold and a formula your reliability engineer can audit.

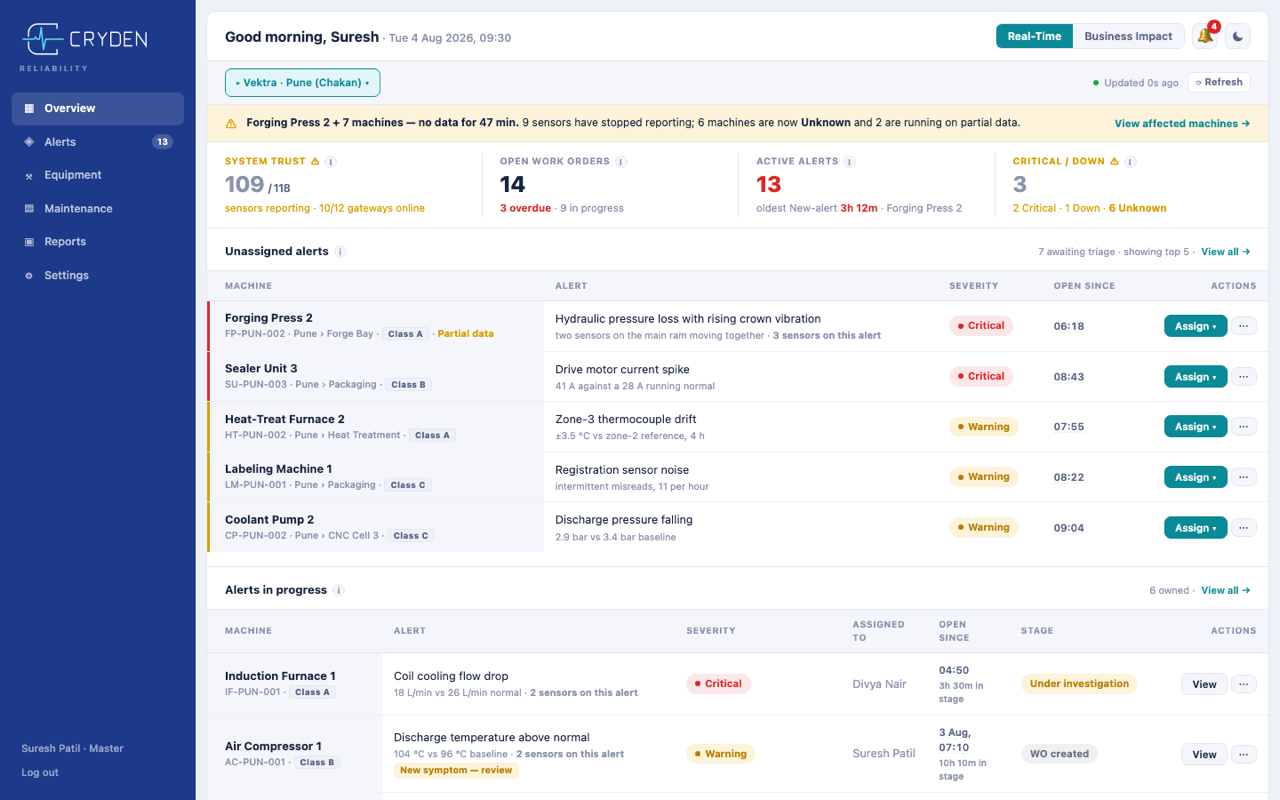
Overview · Real-Time
Cryden Overview screen showing sensor trust, open work orders, active alerts and the unassigned alert queue
Hours + ₹
Unplanned downtime, measured and costed
Planned : Unplanned
The shift from firefighting to prevention
OEE-A
Availability against your own target
ROI
Avoided downtime against subscription cost

The four numbers Cryden puts in front of your board, each traceable to the alerts and work orders behind it.

The Problem

You find out when it is already broken

Between quarterly vibration rounds your plant is flying blind. The data that would have warned you was there the whole time. Nobody was listening to it.

⚠️

Failures arrive without notice

A bearing degrades for three weeks, then takes the line down at 2am. The team scrambles, the shift is lost, and nobody can explain what changed.

💸

Every down hour is lakhs

Lost output, emergency spares at premium, overtime, and a delivery commitment you now have to renegotiate. One unplanned stop erases a quarter of maintenance savings.

📋

Quarterly snapshots are stale on arrival

A third-party vibration round tells you how the machine was on the day someone visited. Degradation does not wait for the next visit.

The Platform

Predict. Plan. Prove it in rupees.

A complete condition-monitoring platform. Alerting, investigation, work orders, reporting and governance in one system.

📡

Always-on machine health

Sensors read vibration, temperature, current and pressure continuously. The on-site gateway does the heavy analysis locally and streams compact features to the platform, so your plant bandwidth is never the constraint.

🔔

Alerting built against fatigue

One alert per machine, not one per sensor. A breach must persist before it raises, and a recovery must hold before it clears. Co-moving symptoms stay on one alert so the diagnosis stays intact.

🧮

Every number is explainable

Each computed figure opens into its definition, its window and its formula. Raw sensor data is available on request at machine and sensor level.

🔧

Alert to work order, closed and graded

Investigation, recommendation, work order, closure. Every alert is graded on outcome, so catches and false alarms are counted.

📊

Reporting that survives the board pack

Executive Summary, Predictive Accuracy, Equipment Performance, Cost Analysis and audit-ready IATF 16949 maintenance evidence. Scheduled and delivered by email.

🛡️

Governance from day one

Four fixed roles scoped to your plant hierarchy, login history, and an append-only change log recording every threshold and rate edit with who, when, and the old and new value.
How It Works

Installed in a day. Watching from the first hour.

Sensors go on, the gateway learns each machine's normal, and your team gets told early enough to act.

1

Sensors go on

Sensors mount on your critical machines: motors, pumps, compressors, spindles, gearboxes and presses.

Under 10 minutes per machine, from registration to verified data flow.
2

The gateway listens

An on-site gateway samples at kHz rates and extracts the features that matter before anything leaves the plant.

Encrypted, roughly one packet per minute per machine.
3

Baselines and bands

Cryden learns each machine's normal, then tracks drift away from it and scores severity against configured bands.

Critical, Warning, Clearing, Cleared. Every state traces to a reading and a threshold.
4

The right person is told

Severity-routed notifications reach the owner and the assignees with the evidence attached.

What changed, since when, which sensors, and how long you likely have.
The Product

The screens your team lives in

Screens show a demonstration dataset.

Overview · Real-Time
Real-time overview with sensor trust, open work orders, active alerts, unassigned alert queue and alerts in progress
What is red right now, what nobody owns yet, and whether the screen can be trusted. Sensor coverage is stated on the page, so a silent sensor never reads as a healthy machine.
Overview · Business Impact
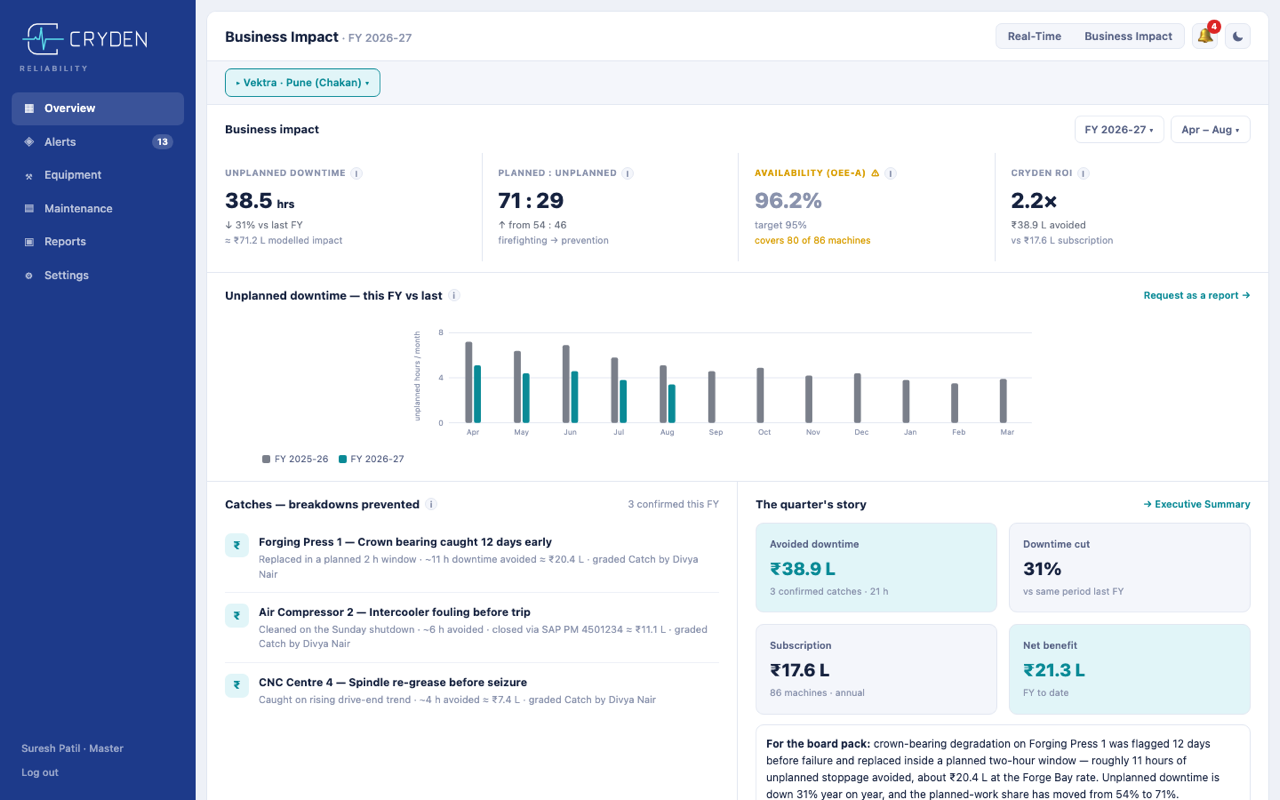
Business impact screen with unplanned downtime, planned to unplanned ratio, availability, ROI, catches log and the quarter's story
Hours and rupees, planned against unplanned, and an evidence log where every rupee traces to a specific catch that a named engineer graded.
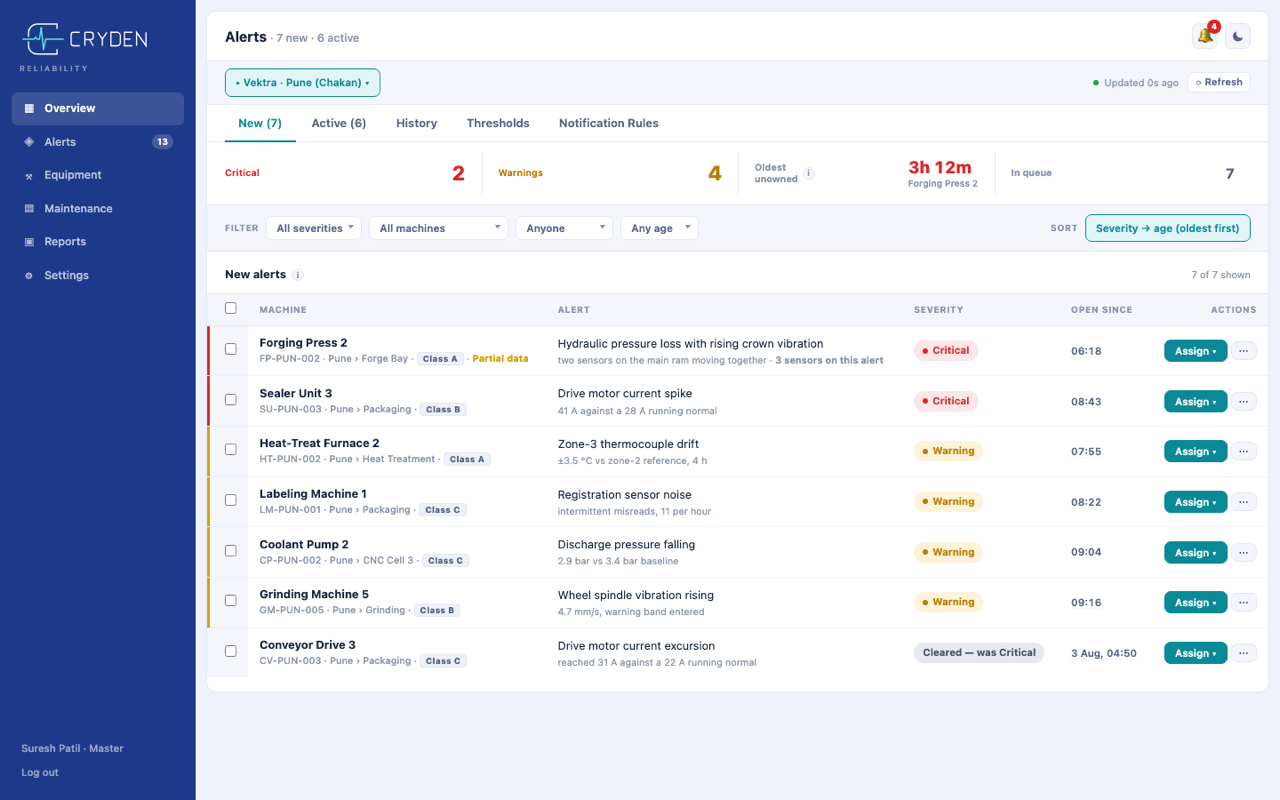
Alerts
Alerts screen with new and active queues, severity chips, thresholds and notification rules
New, Active, History, Thresholds and Notification Rules. Sorted by severity then age, oldest first, so the thing that has been waiting longest is never buried.
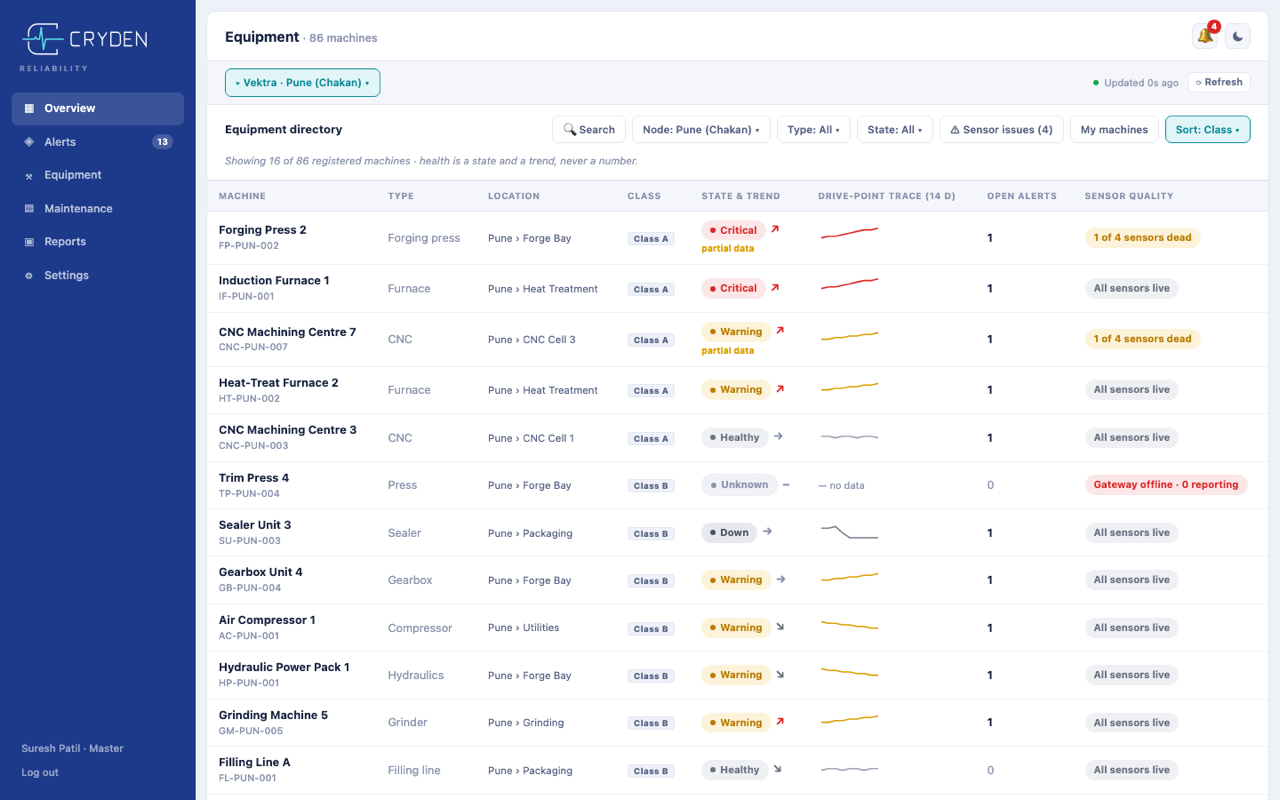
Equipment
Equipment directory with machine health, asset class, sensor quality and active alerts
Every machine with health, asset class, sensor quality and open alerts. Machines with no live sensor are marked Unknown, so coverage gaps stay visible.
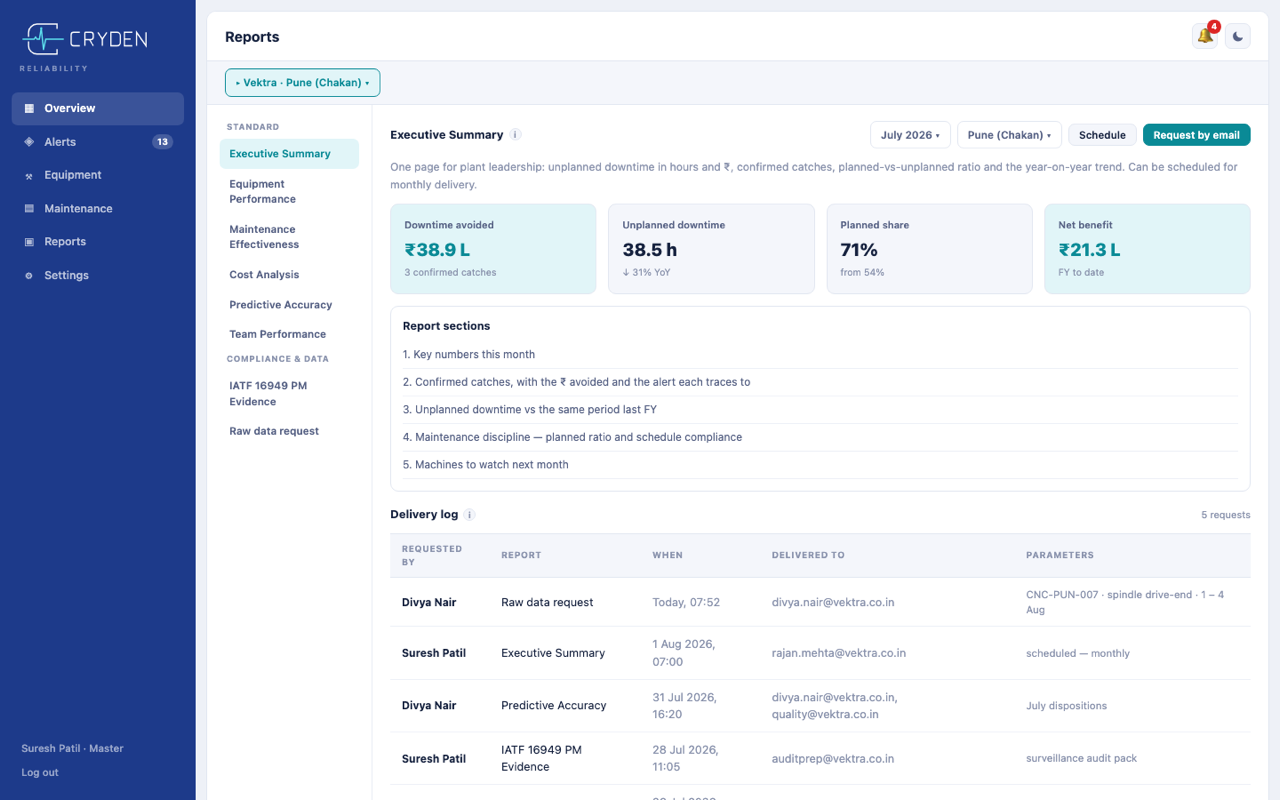
Reports
Reports screen showing the Executive Summary and the standard report catalogue
Executive Summary, Predictive Accuracy, Equipment Performance, Cost Analysis and compliance evidence, each scheduled and delivered by email.
Enterprise Ready

Built for audit, access and evidence

The things a plant IT team, a reliability engineer and an auditor each ask about, answered in the product.

👤

Roles scoped to your hierarchy

Master, Admin, Viewer and Technician, each scoped to specific sites, lines or cells. Permissions are fixed by design, so there is no permission matrix to maintain and no way to misconfigure access.

📜

Append-only change log

Every threshold edit, downtime rate change and role assignment is recorded with the user, the timestamp and the old and new values. This is the answer to who moved the threshold before the missed failure.

🔍

Accuracy you can check

Every alert is closed against an outcome: catch, false alarm, no fault found or inconclusive. The Predictive Accuracy report reads straight off those gradings, so accuracy is measured against outcomes.

Audit-ready maintenance evidence

Preventive maintenance documentation for IATF 16949 assembled from work order records, produced on demand.

Get Started

See it on your machines

Tell us what you run and what keeps failing. We will walk you through the live platform with real machine data and show you exactly what a deployment on your critical assets looks like.

  • A 30-minute walkthrough of the live product
  • A clear read on whether your machines are a fit
  • Scope, timeline and success criteria in writing
Prefer email? Write to [email protected]

We reply within one working day.